
Economic and Community Development Planning
As the Economic Development District for Jefferson and Clallam Counties, the NODC is charged with producing a Comprehensive Economic Development Strategy (CEDS) for the region every 5 years with annual updates in between. The demographics and statistics below are excerpted from the 2026-2030 CEDS.
We also bring people together for discussion, planning and action around key issues facing the region such as broadband access and workforce development and provide tools for planning and evaluation.
Population and Demographics
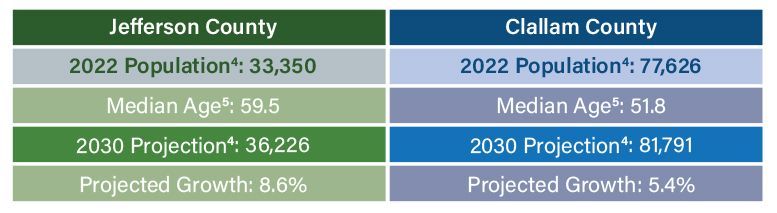
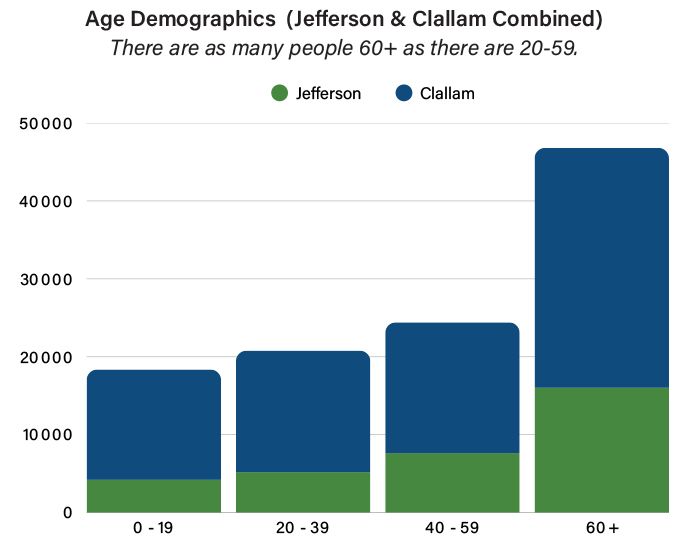
The total population of the two-county North Olympic Peninsula region is approximately 110,976. There is a high percentage of older people in the region, where Jefferson County’s median age is the highest of any county in Washington, and Clallam County’s median age is the sixth highest. The national average for an area this size is 32,967 people 55 or older, while there are 55,062 in this region.
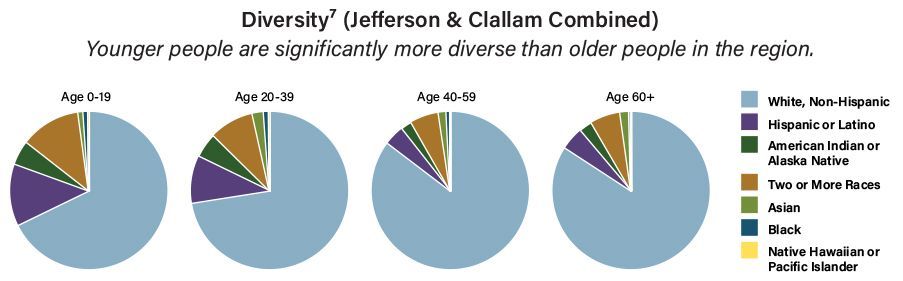
The non-white population in this region is growing slowly but steadily. Diversity in the region increased 29.2% between 2012-2022 (6), while the population who identified as white has decreased from 88.9% of the population in 2012 to 85% of the population in 2022. Approximately 16% of people in the region identify as black, indigenous, or a person of color. This is lower than the national average for diversity of 40%.
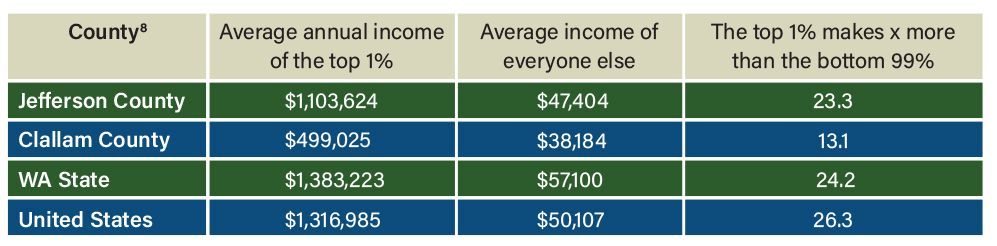
Poverty and Wealth Disparity
The table below shows income inequality for the two counties. It is significantly more unequal in Jefferson County than in Clallam County.
11.2% of people are living at or below 125% of the poverty level in Clallam County, and 12.6% in Jefferson County (9). However, there are pockets of much higher poverty in each county, particularly in more rural parts of the counties and Tribal areas. For Washington State as a whole, the percentage of population in poverty is 9.8%
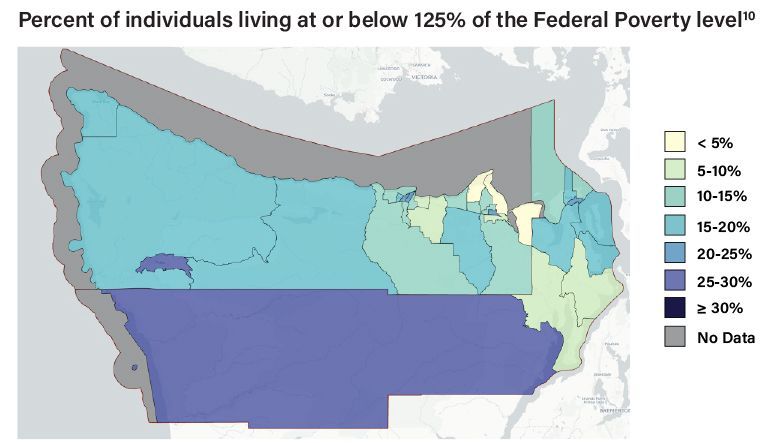
The poverty and wealth disparity reflect the struggle that many people face in securing employment with a livable wage, and in accessing decent and affordable housing, healthcare, childcare, and other services. This poverty and disparity is greater for younger people and people of color and enhances problems related to the aging workforce nearing retirement. Inequality also undermines a sense of equality and results in a disparity of influence over decision-making and use of resources.
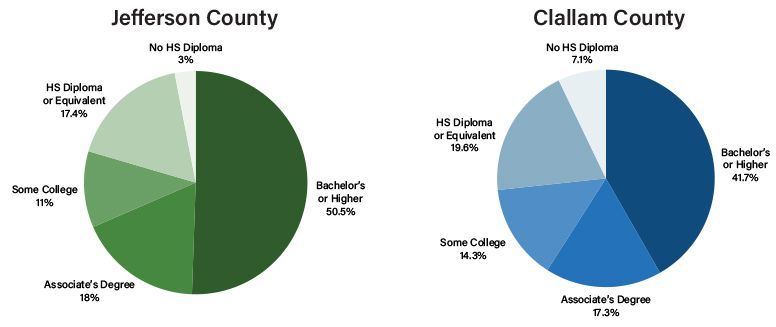
Educational Attainment of Adults Age 25+ (11)
The national average for persons completing a bachelor’s degree or higher is 37.7% (12), and the state average is 40.5% (13). Jefferson County exceeds the state average by a difference of 10%, and Clallam County is above the state average by a difference of 1.2%. Many of the more educated individuals in Jefferson County in particular are retirees who moved to the area and are not in the workforce. The working population, therefore, has a lower education level than data including retirees suggests. Although they are not in the workforce, many of these educated retirees add to the community in a volunteer capacity.
Workforce & Employment Data
There are approximately 41,346 people in the workforce in the two counties. From 2018 to 2023, jobs increased by 3% in Clallam County from 28,644 to 29,513 (1.8% lower than the national growth rate of 4.8%), and the labor force participation rate decreased from 49.5% to 47.8%. From 2018 to 2023, jobs increased by 2.3% in Jefferson County from 11,569 to 11,833 (2.5% lower than the national growth rate), and the labor force participation rate decreased from 45.3% to 43.3%. As of 2023, people ages 55+ made up 31% of the workforce in Clallam County and 38% in Jefferson County. The labor force participation rates for both counties are significantly lower than the state average of 65%, which is largely due to the high retiree population but also reflects higher than average numbers of residents of prime employment age (25 to 54) who are not in the workforce.
A significant portion of the workforce is made up of people ages 55+, which presents a high risk in this area for losing workforce. Having a population with a large number of retirees and near-retirees, and not as many younger people, will have implications for finding young workers to fill job vacancies in the future. It is currently difficult to attract professionals with young families to the region, because of housing costs and availability, limited career path options, and limited amenities for families.
Unemployment
As of July 2025, the unemployment rate for the region was 4.5% (14). Over the past 30 years, the unemployment rates in the region have been higher than the state and national averages by up to 4%, with Clallam County’s unemployment usually running a little higher than Jefferson County’s (see graphs in Appendix D). However, post-Covid, unemployment rates in both counties are showing a reduced gap between the local rate and the state and national rate, possibly indicating a convergence
with larger economic patterns.
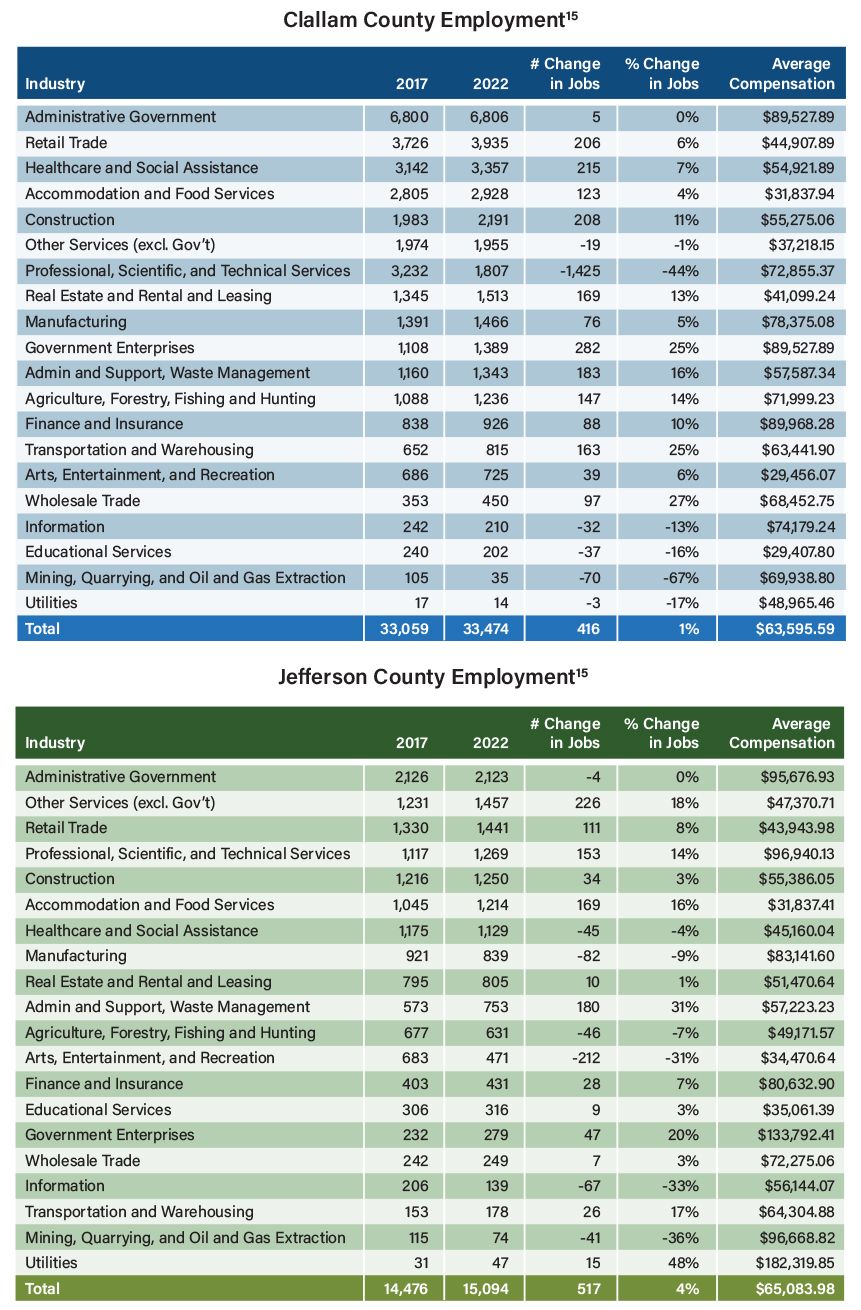
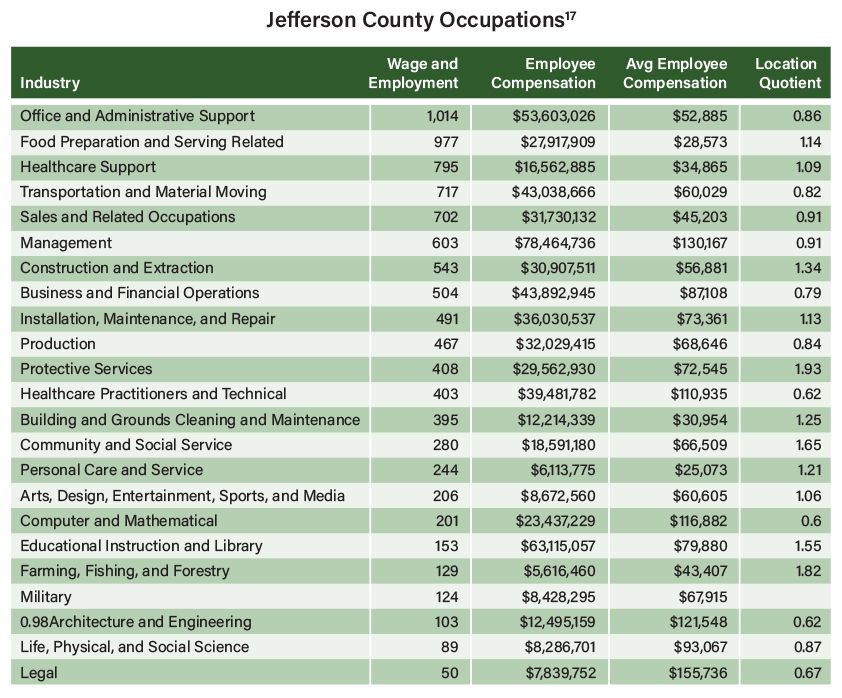
Top Industries: # of Jobs
The charts below show the top industries in each county by number of jobs. While this information is important, it can be misleading for a few reasons. First, many industries are split up into different industry codes, so they do not show up in the highest rankings even if they provide many jobs. For example, some logging businesses show up in the transportation sector. The maritime sector is split among transportation and warehousing, maintenance and repair, and manufacturing. Local government jobs are high, because they include a range of employees such as those in schools and healthcare institutions combined. It’s important to recognize that, when taken together, small businesses are the largest employer in the region, but they are dispersed across industry codes and therefore do not show up as a category in the job rankings.
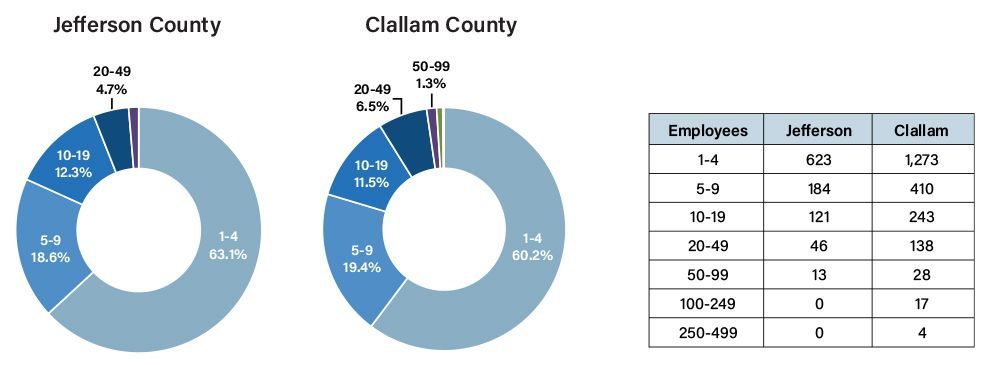
Business Size
There are approximately 3,100 businesses registered in the region. The graphs (18) below reflect the size of these businesses and the important role that smaller businesses play in the region. Some of the larger businesses may be headquartered in the region, but have locations and employees outside of the region.
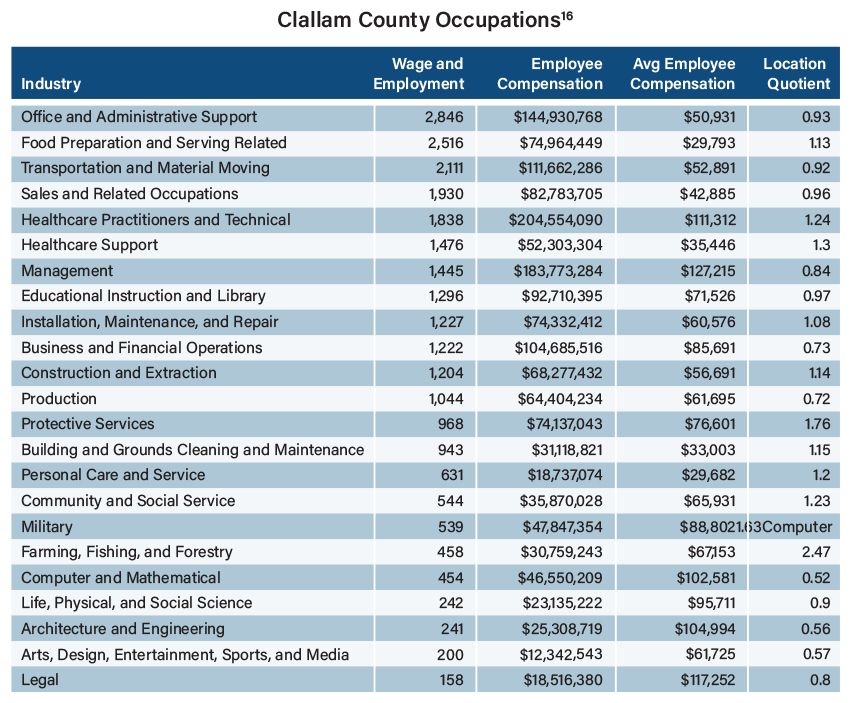
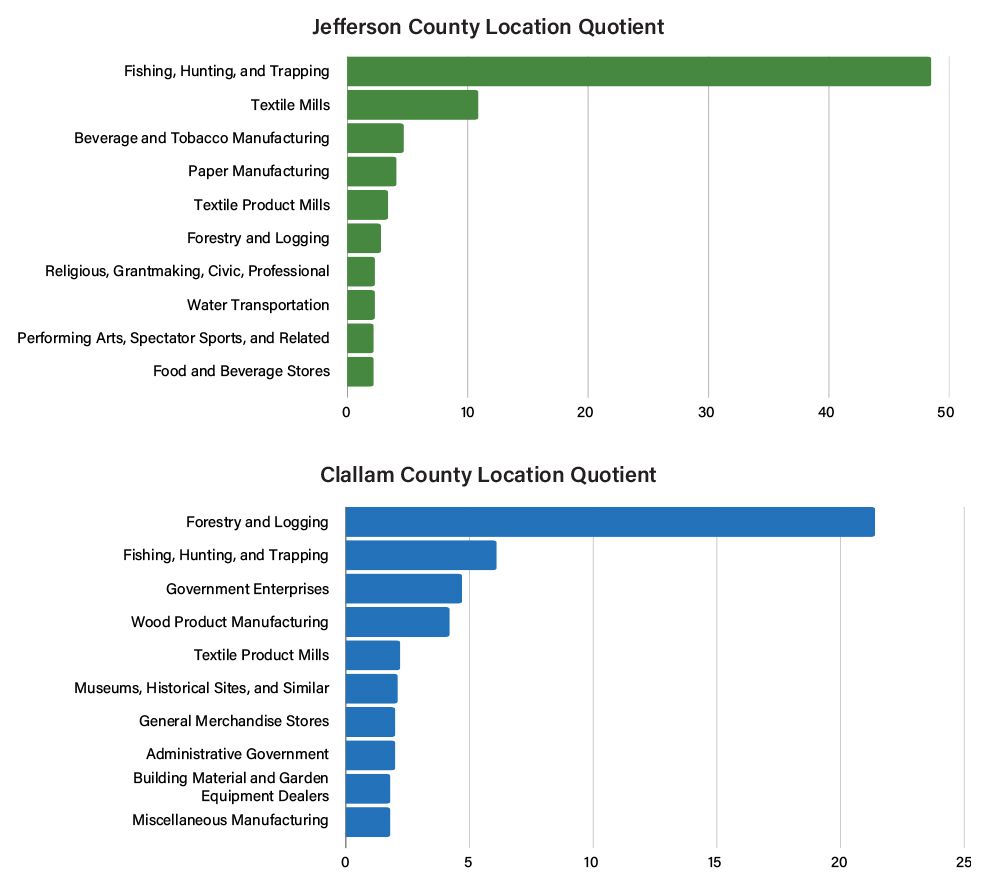
Location Quotient
Location Quotient represents the regional industry concentration relative to the national average. These graphs reflect the area’s richness in natural resources and corresponding concentration of related industries.
4 Washington State Office of Financial Management, Growth Management Act Population Projections for Counties: 2020 to 2050, County Projections, 5-year Intervals, Middle Series
5 U.S. Census Bureau. Table B01002: Median Age by Sex. American Community Survey, 5-year estimates, 2023. https://data.census.gov
6 Simpson’s Diversity Index
7 U.S. Census Bureau. B01001A-B01001I: Sex by Age by Race/Ethnicity. American Community Survey, 5-year estimates, 2023. https://data.census.gov
8 Economic Policy Institute. https://www.epi.org/multimedia/unequal-states-of-america/#/Washington
9 U.S. Census Bureau. C17002: Ratio of Income to Poverty Level in the Past 12 Months. American Community Survey, 5-year estimates, 2023. https://data.census.gov
10 U.S. Census Bureau. C17002: Ratio of Income to Poverty Level in the Past 12 Months. American Community Survey, 5-year estimates, 2023. https://data.census.gov
11 U.S. Census Bureau. Table B15003: Educational Attainment for the Population 25 Years and Over. American Community Survey, 1-year estimates, 2023. https://data.census.gov
12 U.S. Census Bureau. American Community Survey, 2022
13 U.S. Census Bureau (2023 ACS 1-Year Estimates)
14 Washington State Employment Security Department Local Area Unemployment Statistics: https://esd.wa.gov/labormarketinfo/labor-force
15 IMPLAN Group, LLC. (2017 & 2022). Employment and compensation data (546 industry scheme). IMPLAN. Retrieved August 2025, from https://implan.com
16 IMPLAN Group, LLC. (2022). Occupation data: Employment, compensation, and demographics by SOC code. IMPLAN. Retrieved August 2025, from https://implan.com
17 IMPLAN Group, LLC. (2022). Occupation data: Employment, compensation, and demographics by SOC code. IMPLAN. Retrieved August 2025, from https://implan.com
18 U.S. Census Bureau (2023). CB2300 County Business Patterns. Retrieved August 2025, from https://data.census.gov