")

REGIONAL CLIMATE CHANGE IMPACTS
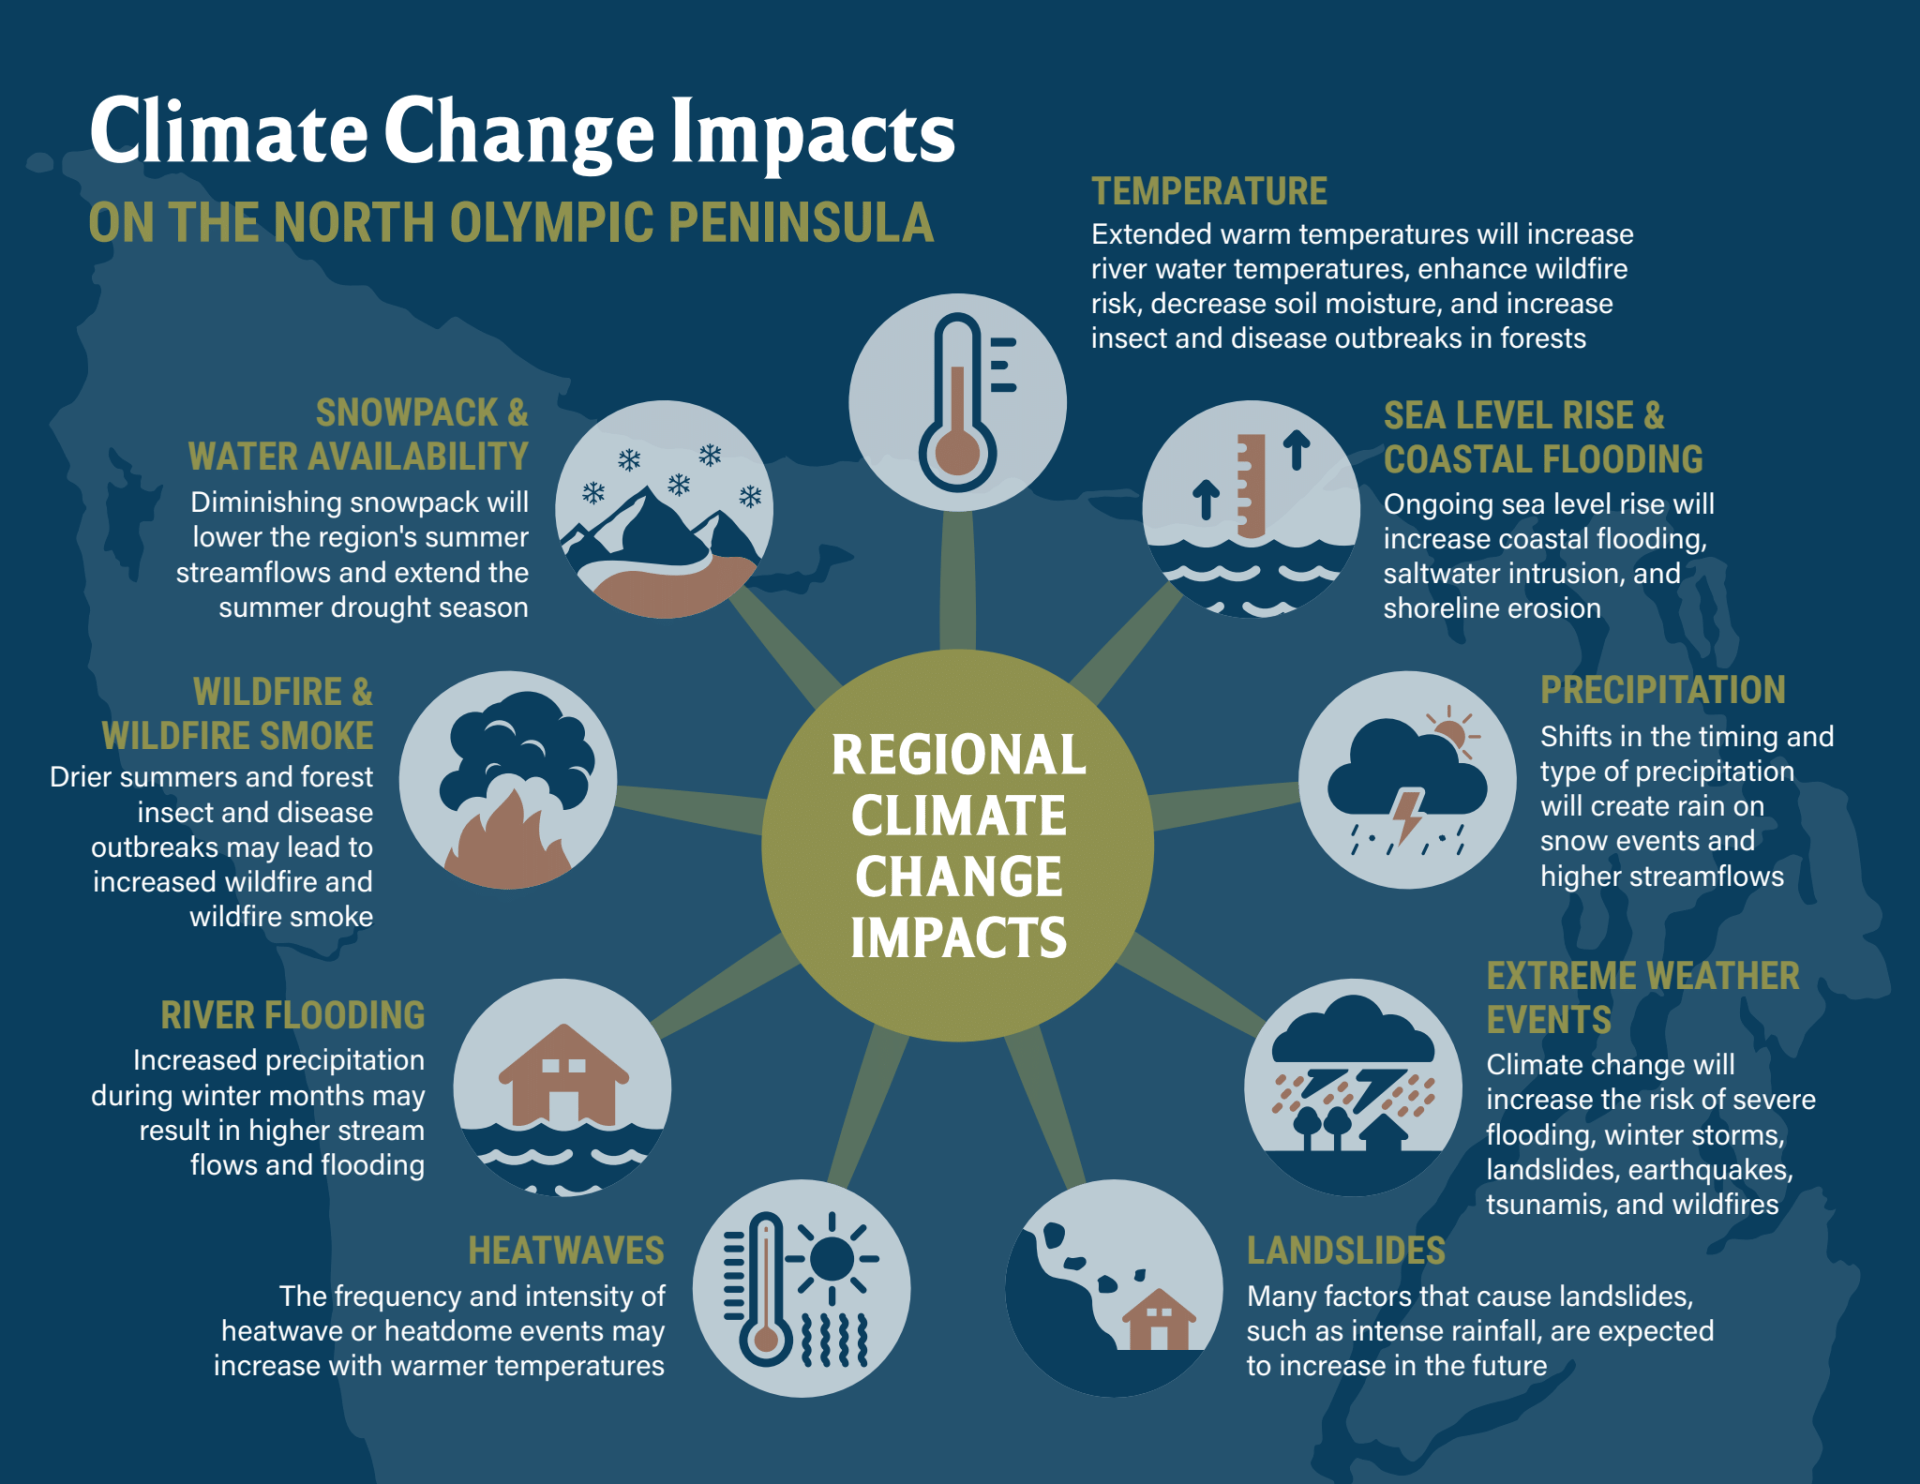
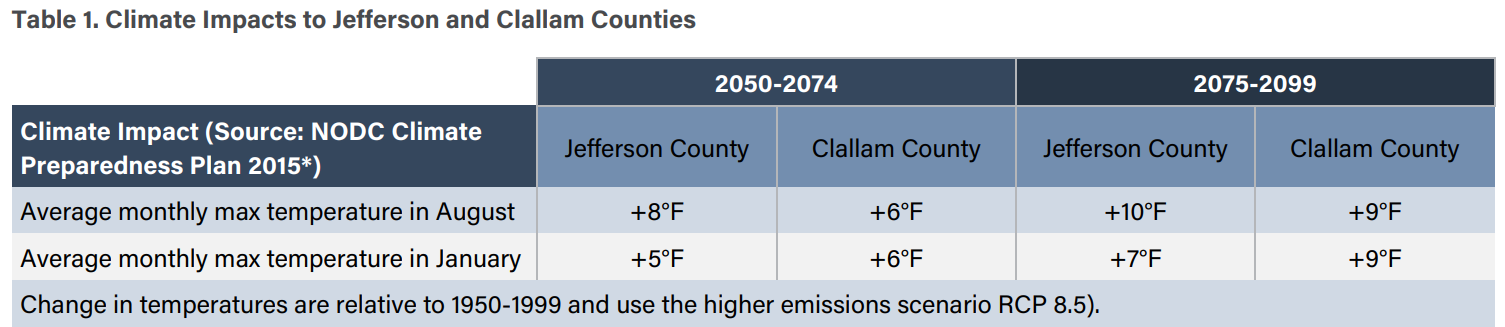
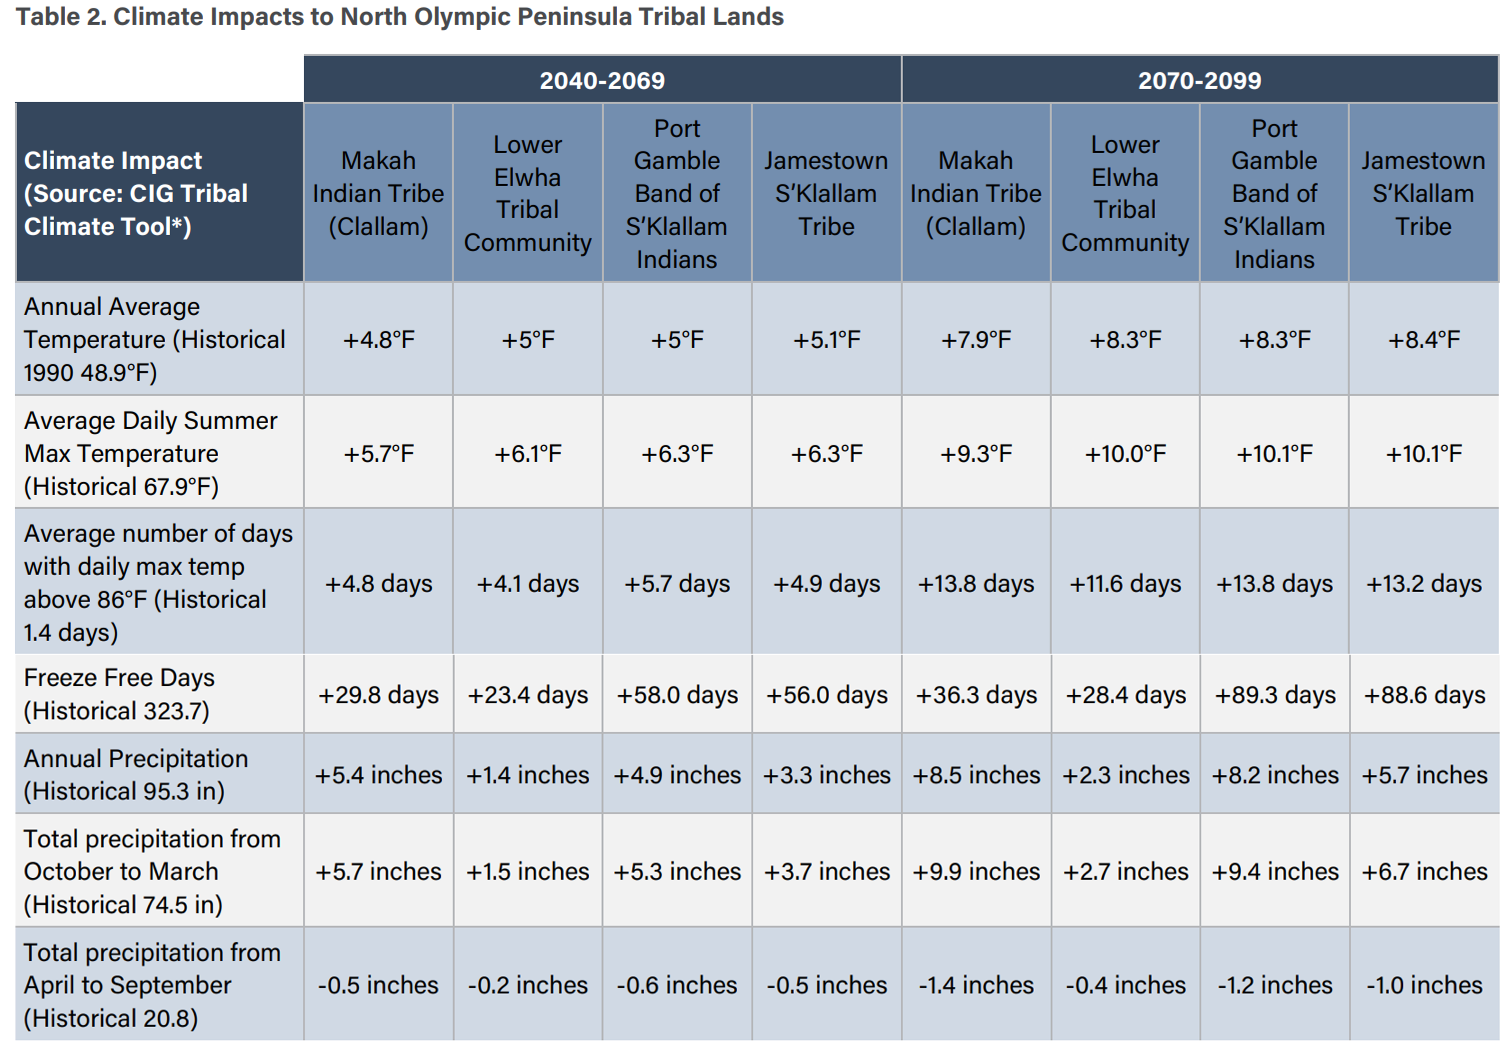
Across the Northwest, observed temperatures have warmed nearly 2°F on average over the last century (May et al. 2018). Climate projections for communities in the North Olympic Peninsula predict higher temperatures and changes to precipitation. As shown in Table 1 and Table 2, the region is expected to see higher annual average temperatures, with higher temperature increases during the summer months, and more days with average temperatures above 86°F. Projected regional warming will lead to more freeze-free days and reduced snowpack, which will result in changes to the hydrologic basin conditions, moving more of the Olympic Peninsula’s watersheds from a mixed rain and snow dominated system to a largely rain dominated system by 2100 (WSDOT Climate Impacts Vulnerability Assessment). Reduced snowpack will also result in less water availability for streams during the late summer months, affecting salmon habitat, water quality, and streamflow.
Table 2 shows projected changes in annual precipitation across the region. While climate models predict less rainfall in the summer months, they also show that we can expect more precipitation during the winter months. Increased winter precipitation, along with more precipitation falling as rain rather than snow, means that riverine flooding may occur more frequently in the future.
Coastal flooding from higher sea level is another anticipated climate impact on the North Olympic Peninsula (see Table 3). Drawing on the 2018 Assessment of Projected Sea Level Rise for Washington State, the Climate Impacts Group developed an interactive sea level rise data visualization tool that presents anticipated likelihoods of sea level rise rates across Washington State.
For a more comprehensive overview of regional climate impacts across the North Olympic Peninsula, see the 2015 NODC Climate Preparedness Plan for the North Olympic Peninsula, which includes information about sea level rise, changes to rivers and hydrologic systems, and other regional climate impacts in more detail.